A Legal Marketer’s Guide to Creating Infographics

What are Infographics?
In the simplest terms, infographics present complex information in a visual form using pictures, colors and content that naturally draw the eye. They are also easily shared on social networks and have a better chance of becoming viral compared to text.
Infographics can take many forms, and will largely depend on the information you want to communicate. They are useful for showcasing data, research findings, step-by-step guides, checklists and many other types of information. The most common types of infographics used by law firms are statistical infographics, informational infographics and editorial infographics.
Tools to Create Infographics
A variety of online and offline tools are available to create the perfect infographic for your legal marketing strategy. Each has its advantages and disadvantages, but it doesn’t take much effort to check out a few and find one that will work for you. Following are a few of some of the popular tools with brief descriptions.
Canva – This online program is free, has hundreds of designs and fonts and is very easy to use. Canva is, arguably, the most popular tool for creating infographics.
Venngage – Infographics including charts, images, and maps, can be created through a selection of templates in three quick steps. Venngage has more advanced features for users who want to have a bit more freedom and control over the final image.
Vizualize – If you want to spice up written documents for internal processes, this is the perfect tool. It’s also a great tool you can use to enhance your resume.
Easel.ly – You can choose from loads of templates, fonts, and features to design your law firm’s infographic. One of Easel.ly’s specialties is templates that can be used to illustrate the workings of linear (or not so linear) processes.
Infogram – Users can create interactive and animated charts, reports and graphs with Infogram, another tool available online.
Visme – This web application has multiple functions to create infographics, short animations, and presentations.
Out of the above tools, Canva is probably the most widely used for law firm infographics. If you’ve never created graphics before, it would be a good place to start and get a basic idea of how things work. From there you can try others to see if their extra features prove to be useful or not.
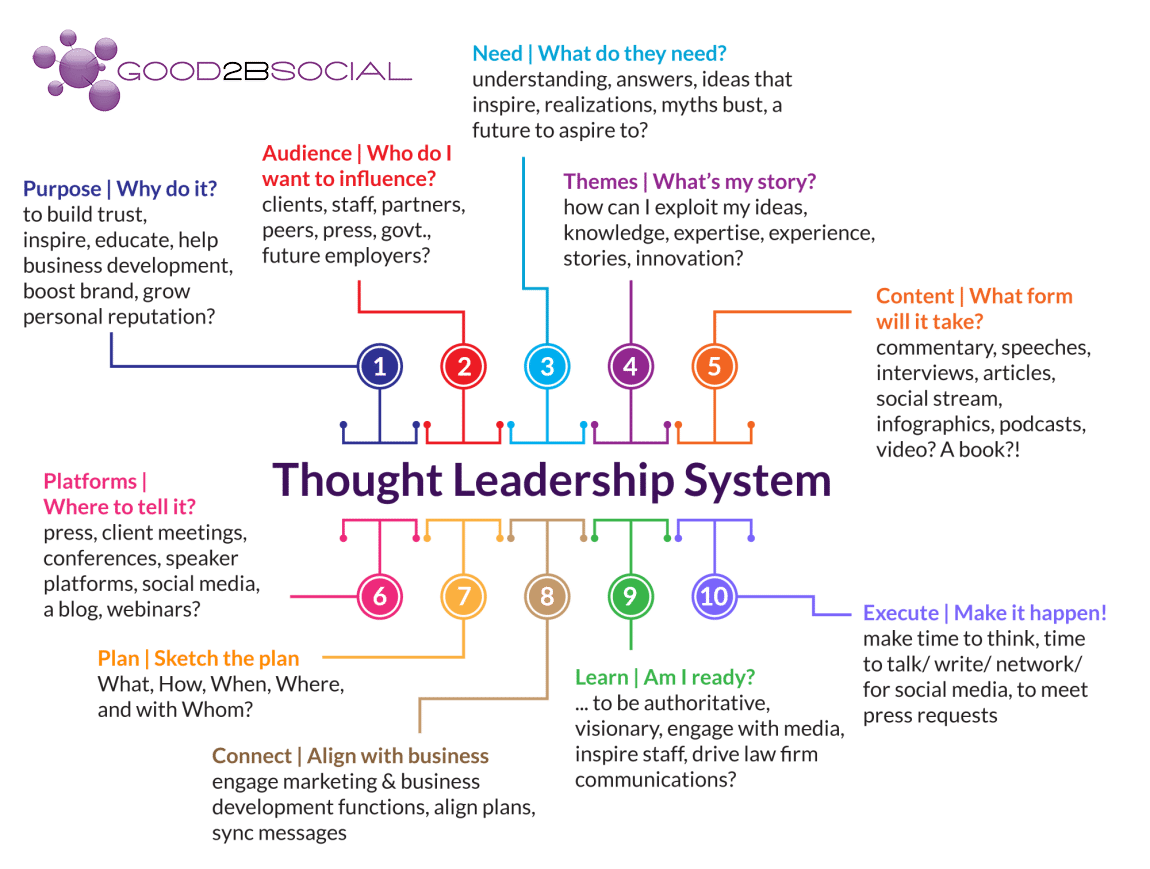
Here’s an example of how we reduced an entire blog post to a graphic to use in a PowerPoint presentation:
How to Make The Best Use of Infographics
Data is meaningless when it’s presented on its own without context. The first thing you should consider is the purpose of your infographic. Are you trying to simplify complex data? Are you showing a comparison between two things? Maybe you’re outlining how a legal process plays out. The end goal will guide you in creating your graphic.
Most of the tools we mentioned above have templates based on the type of information you’re trying to convey. They should give you a good starting point that you can tweak somewhat if needed.
Your overall goal is to make sure the finished product is clear, attractive, and accurate, presenting the data in an informative and meaningful way.
How to Make Infographics Shareable
People share what they find useful, interesting, and relatable. If you can incorporate these elements into an infographic, you have the perfect recipe for a shareable law firm infographic.
A good infographic solves or offers solutions to major problems in your audience’s lives. One of the best ways to find these problems that need solving is to ask your audience directly with a questionnaire or to analyze comments you’ve received on previous blog posts. If someone finds your infographic informative and highly relevant, they’re going to share it with their friends and contacts.
Infographics Could Be The Boost You’re Looking For
Even the most dry and incomprehensible data suddenly becomes digestible and interesting when presented in the right way. Infographics that break down complex law firm topics and legalese help bridge the communication barriers between clients or prospective clients and lawyers, leading to more educated clients and a stronger attorney-client relationship. If you’ve been looking for a way to spice up your blog posts and generate more buzz on social media, infographics might be the answer.
Subscribe to our weekly newsletter to stay on top of the latest developments in legal digital marketing and learn best practices and tips to enhance your marketing and business development efforts at your firm.
Updated and republished from Sep 25, 2017.
Let’s get started, and finished
Contact us to get started on your Technology Strength Scorecard and energize your business development process.
Contact Us


